AI in Healthcare: Pulmonary Embolism Detection Using YOLOv8
Tackling a Critical Condition with High-Performance AI
DATA SCIENCE & ANALYTICS
Viktor Zarakov
11/23/2025
Pulmonary Embolism remains one of the most challenging and critical diagnoses in medicine, where early, accurate detection is paramount to patient survival. My recent project delves into the application of High-Performance Artificial Intelligence to improve this detection process. I leveraged existing public image datasets of PE cases to train and validate a cutting-edge computer vision model: YOLOv8 (You Only Look Once version 8).
💻 Project Goal: Setting Up and Training YOLOv8 for PE Detection
📈 Quantitative Analysis: Performance Validation
The core task of this project was to set up and train the YOLOv8 model on a publicly available PE image dataset sourced from a GitHub repository. YOLO is renowned in the computer vision world for its excellent balance of high speed and accuracy in object detection. While the original YOLO design focuses on drawing bounding boxes around objects (detection), the specific variant I employed in this research was the YOLOv8n-cls model.
To validate the model's clinical viability, I performed an in-depth quantitative analysis using standard machine learning evaluation metrics.
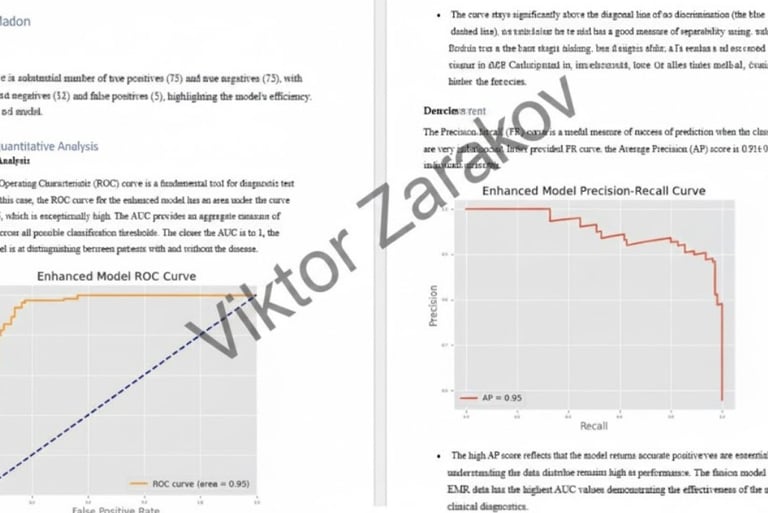
1. ROC Curve Analysis
The Receiver Operating Characteristic Curve is a fundamental tool for diagnostic test evaluation.
The Enhanced Model ROC Curve analysis shows an Area Under the Curve of 0.95, which is exceptionally high. This high AUC confirms that the model is excellent at distinguishing between patients with and without the disease
The curve is significantly above the diagonal line of no discrimination, suggesting a great measure of separability.
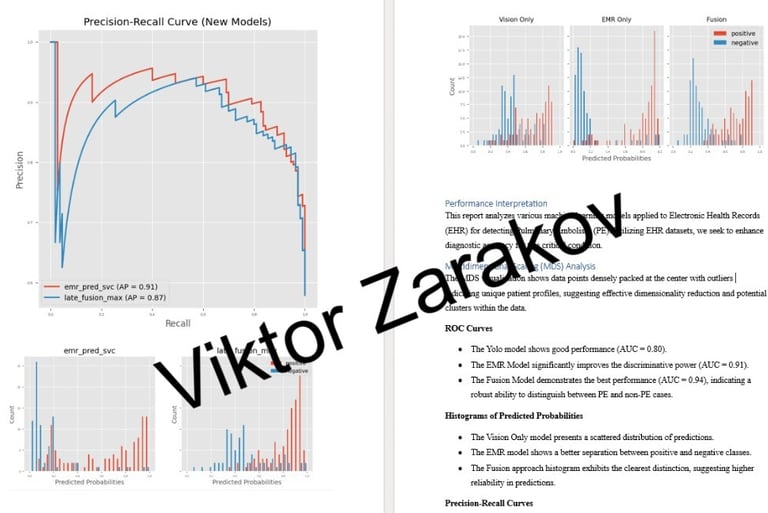
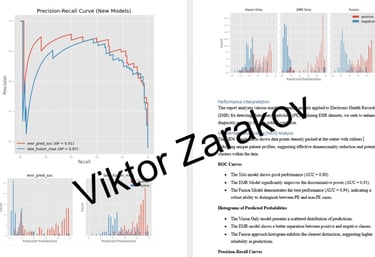
2. Precision-Recall Curve Analysis
Given that medical datasets often have a class imbalance (fewer positive PE cases than negative ones), the Precision Recall Curve is a more useful measure of success.
The Enhanced Model Precision-Recall Curve shows an Average Precision score of 0.95. This high AP score reflects that the model maintains a high precision across various recall levels, meaning the rate of returning accurate positive predictions remains high
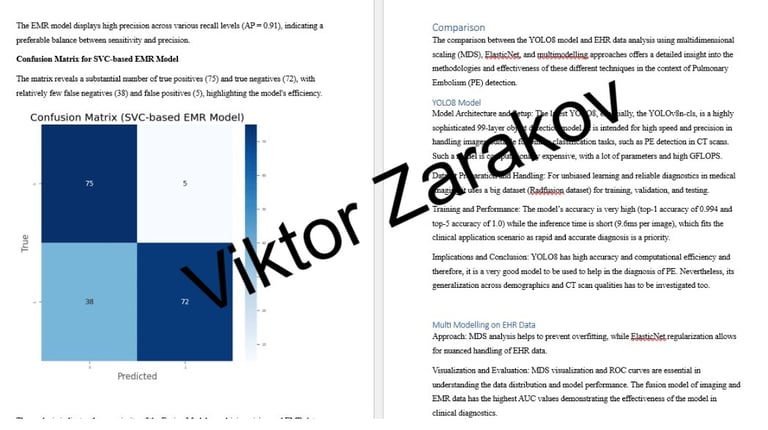
3. Confusion Matrix Analysis
The Confusion Matrix provides a direct look at the model's classification efficiency.
The matrix for the SVC-based EMR Model reveals a substantial number of true positives (75) and true negatives (72), with relatively few false negatives (38) and false positives (5), highlighting the model's efficiency in the EMR data (as seen in the confusion matrix).
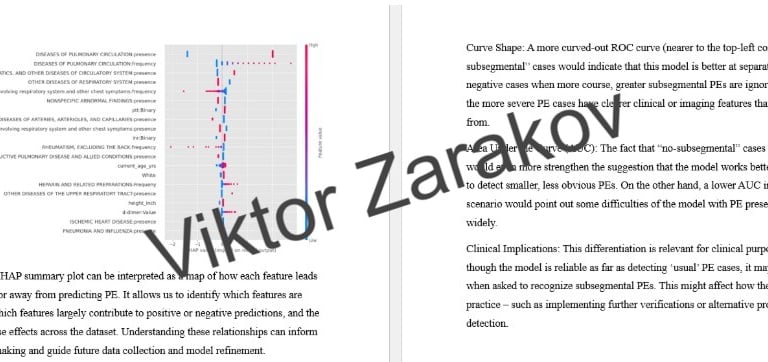
4. Feature Importance
To understand why the model made its predictions, I used a SHAP summary plot.
This plot maps how each feature leads the model toward or away from predicting PE. It allows for the identification of which features are most important (e.g., specific clinical symptoms or comorbidities) and informs future data collection and clinical decision-making